How is Engagement Time Reported in GA4?

Where Are the Engagement Time Reports in GA4?
We recently wrote an article explaining Engagement Time in GA4 that covers how Engagement Time is gathered and how it differs from time related metrics in Universal Analytics (UA). This post will cover where you can find Engagement Time Metrics in Standard Reports, how you can use them in Exploration Reports, and some quirks you should be aware of.
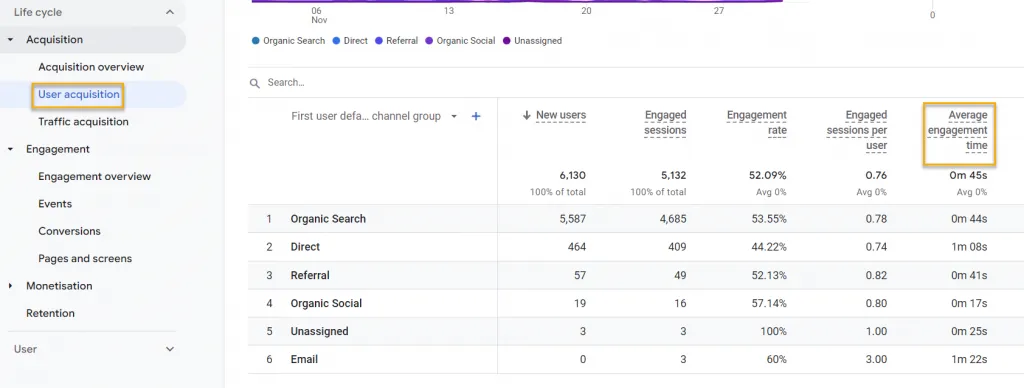
There are four Standard Reports that include Engagement Time metrics:
The User Acquisition report includes Average Engagement Time.

The Traffic Acquisition report includes Average Engagement Time per Session.

The Engagement Overview also has Average Engagement Time per Session.

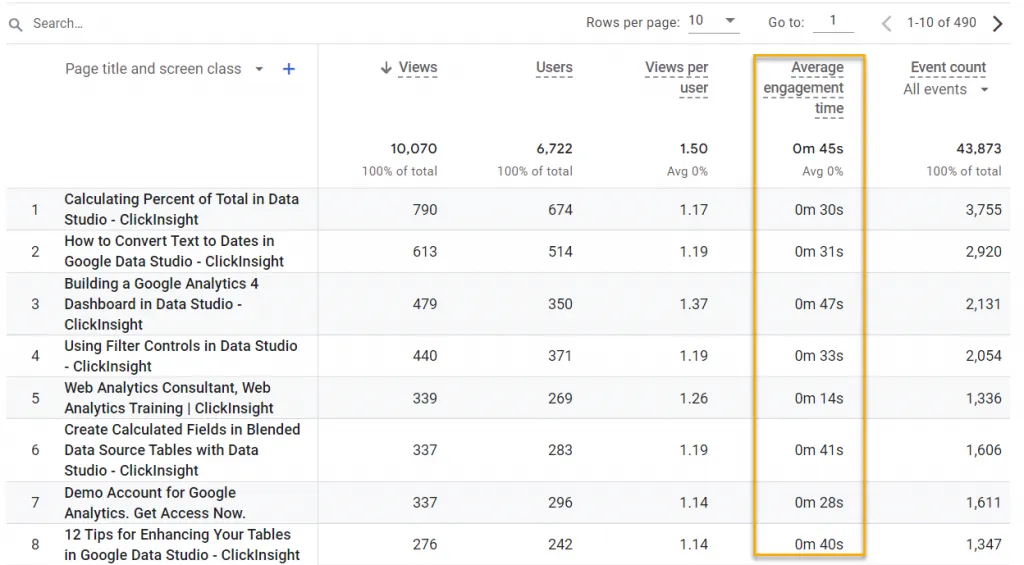
The Pages and Screens report has Average Engagement Time.

You’ll note that in two cases, it is specified that the Average Engagement Time is per Session, and in the other two, it is just called Average Engagement Time.
Interpreting Average Engagement Time per Session & Average Engagement Time per… uhh… Good Question
Average Engagement Time per Session is kind of a no brainer. If you know what GA4 Engagement Time is, it’s pretty easy to figure out what it means when you average it by sessions. Barring some details about how they are collected, Average Engagement Time per Session in GA4 can be thought of as a more accurate version of Session Duration in UA.
That leaves the Average Engagement Time metric, as used in the User Acquisition and Pages and Screens reports. The issue with interpreting this one is that we don’t know what the average is by. As far as the Pages and Screens Report, the default dimension is Page title and Screen Class, and the first metric is Views. Looking at that, it would certainly be logical if it was Average Engagement Time per View. Especially since Average Time on Page was an important engagement metric for so many analysts in Universal Analytics.
Can we think of Average Engagement Time on the Pages and Screens report the way we thought of Average Time on Page in UA? No, absolutely not, though you certainly wouldn’t be alone in making that mistaken assumption.
So what can we think of it as? Let’s find out.
Average Engagement Time per Page View User?!?
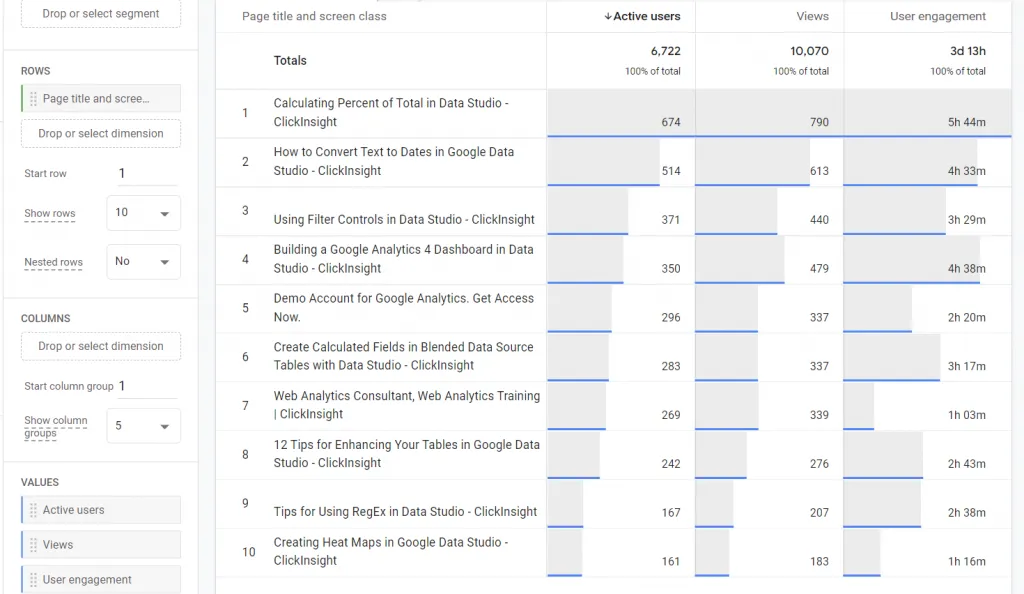
To figure out what is going on, let’s jump into the Exploration Reports, where we have a lot more flexibility to slice and dice things. We’ll make a simple Free-Form report that reproduces some of the data on the Pages and Screens report. Our Dimension is Page Tile and Screen Class, and we’ll pull the metrics Active Users, Views, and User Engagement.

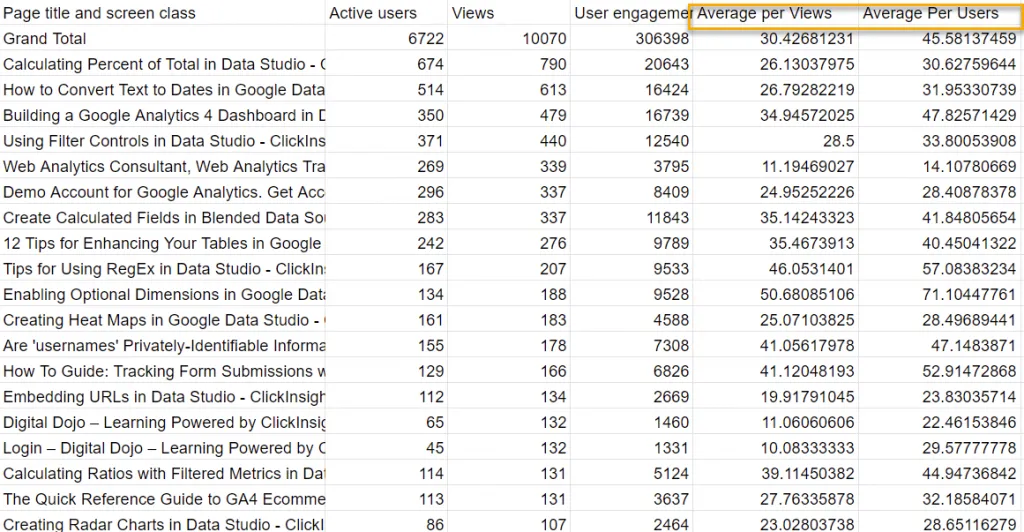
One of the first things you’ll note is that User Engagement time seems really high, until you realize that, in its current state, it is reporting the total amount of engagement on that page. It hasn’t been averaged by anything yet (the only Average Engagement Time metric you have access to in Exploration Reports is per Session). The next thing we’ll need to do is pull this data into a spreadsheet so we can do some averaging ourselves.
We divide Engagement Time by views to get Average Engagement Time per Page, and by Users to get Average Engagement Time per User.

Now, let’s compare our numbers to what is in the Pages and Screens Standard Report:

We can tell right away that the Average Engagement Time in the Pages and Screens report is not reporting averaging per View.
We should probably stop here and point out that pulling your Engagement Time into a spreadsheet or similar tool and dividing it by Views is the only way to get a number equivalent to Average Time on Page in UA. That metric simply doesn’t exist inside GA4 (for the time being, anyway).
If we compare the Average Engagement time in the Standard Report to what we have in the Average per User column of our spreadsheet, we see that they line up. So Average Engagement Time in the Standard Reports is more accurately Average Engagement Time per User.
What Am I Supposed to Do with Average Engagement Time per User?
While many of us are probably disappointed that we still don’t have Average Time on Page in GA4, Average Engagement Time per User is still a valuable metric. Taken on its own, it’s probably a clearer sign of Engagement than Average Engagement Time per View. Looking at the total time a user spent on a page over (possibly over multiple pageviews) represents Engagement well in a single number.
When looking at Time on Page per View, you always have to account for the number of Views the page got. A page with high Average Time on Page may appear to have a lot of engagement compared to a page with a lower time, but how many times a user looked at a page is a key factor. As an example, that super long blog post a few people read might have great Time on Page, but maybe people actually spend more time in total on a summary post with lots of links that they return to several times.
If you want to know how people interact with a page in a single View, Average Engagement Time per User isn’t that helpful, and you’ll need to extract and manipulate your data as we showed above. As an overall indicator of what is getting engagement and what isn’t, though, it has its place.
Now that you know all about it, you can start using Engagement Time and its various averages in your reporting and analysis. Let us know how it’s going in the comments. If you are stuck or have a question, maybe we can help!
Got questions? Drop us a comment, or describe your biggest challenge or frustration.
Other posts in our 12 Days of Google Analytics 4 series:
1.GA4 “Configure” is Moving to Admin
2.How to Set Up Cross-Domain Tracking in Google Analytics 4
3.Get Your Hands on Real GA4 Data Today with the Google Analytics 4 Demo Account
4.What is Engagement Time in GA4?
5.Why your GA4 Looker Studio Report is Broken
6.Did your Looker Studio GA4 Numbers Increase After Applying Filters?
7.How is Engagement Time Reported in GA4?
8.How Ecommerce Tracking in GA4 is Different from UA
9.How to Create and Modify Events in GA4
10.When to Use GA4 Rollups & Subproperties
11.What in GA4 replaces Universal Analytics’ Views? Hint: It’s NOT GA4 Data Streams
12.Why am I seeing blank rows or (not set) in my GA4 Landing Page Report?
